

Will the January Barometer Come Through?
A positive January has historically been a bullish sign for stocks. Yale Hirsch, creator of the “Stock Trader’s Almanac”, first discovered this seasonal pattern back in 1972, which he called the January Barometer and coined its popular tagline of ‘As goes January, so goes this year.’ Here, we assess the likelihood that this popular stock market adage delivers more gains for investors this year. The weight of the evidence leans toward yes, as we explain.
January Gains Signal Strong 2024
As highlighted in the chart “Positive Januaries Tend to Lead to Positive Years”, the popular Wall Street maxim has stood the test of time. Since 1950, the S&P 500 Index has posted an average annual return of 16.8% during years that included a positive January, with gains impressively 89% of the time. In contrast, when the index traded lower in January, annual returns dropped to -1.7%, with only 50% of occurrences yielding positive results.
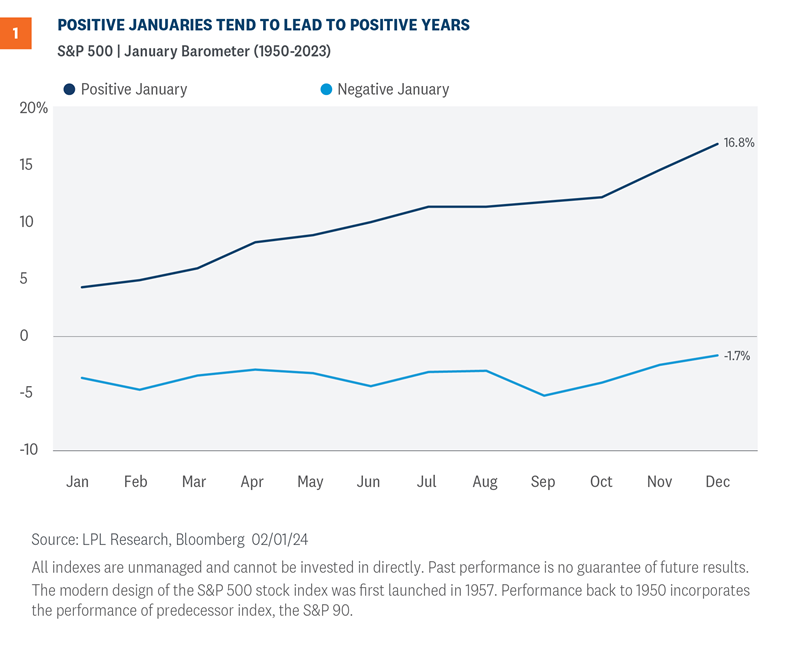
Isolating just February through December, the index has gained an average of 12% during years when January is higher, rising 86% of the time. And during election years when January is positive, such as this one, the S&P 500 has not traded lower over the subsequent 11 months in any year since 1950 (eight for eight), with an average gain of 10.1% during this period.
Will the January Barometer Work This Year?
We understand that every year for the stock market is different and that some statistical patterns work well for a while, and then they don’t (the famous Super Bowl indicator comes to mind). But this year, we believe this pattern stands a good chance of holding up for the following reasons:
- Easing inflation to bring Federal Reserve (Fed) rate cuts. Inflation should come down further over the next 11 months as the economy slows, enabling three or four rate cuts from the Fed (maybe starting as early as May) and putting downward pressure on intermediate and long-term interest rates. The strong January jobs report may delay the drop, but it is still likely to come. Lower interest rates should help support stock valuations (as we wrote in last week’s Weekly Market Commentary).
- Earnings are on the rebound. The stage is set for a solid earnings ramp in 2024 thanks to: 1) easy comparisons from 2023 earnings declines in energy and healthcare, 2) ongoing pricing power from still elevated (but easing) inflation, and 3) a resilient U.S. economy supported by a healthy job market, resilient consumers, and fiscal stimulus. It looks like big tech has saved fourth quarter earnings season, providing a solid base from which to grow.
- Delayed returns to record highs tend to be followed by solid gains. Here’s another stock market pattern that tends to work. Since 1950, after a more than one-year delay to return to prior highs, the S&P 500 has gained an average of 11.7% during the subsequent year, with gains in 13 of 14 occurrences.
- Stocks tend to rise during election years, particularly when an incumbent is running for re-election (as we wrote about in the “How Markets Regard Democratic Incumbents” blog last week). There aren’t a lot of cases in the modern stock market era (just 10 since 1950), but the S&P 500 has gained an average of 12.5% during election years when incumbents are running, with gains every time. Stimulus from the Biden Administration — that which was already passed and what is yet to come — may keep the U.S. economy out of recession even as the effects of tighter monetary policy continue to flow through.
At the same time, we think the path to gains this year will be bumpy. The average maximum drawdown for the S&P 500 during an election year since 1980 is 16.2% — markets don’t like uncertainty. The market may be disappointed if Fed rate cuts are delayed by stubborn services inflation and a job market too hot for Goldilocks.
And of course, this is one of the more treacherous geopolitical environments in recent history with China-Taiwan tensions, the risk of a wider conflict in the Middle East, and the massive U.S. debt pile that is becoming more expensive for the federal government to service. The glut of Treasuries for markets to digest may keep market-based interest rates higher for longer and frustrate bond investors.
Is the S&P 500 Ahead of Itself?
This is a legitimate question, with stocks having recently rallied to record highs after falling the first week of the year. The S&P 500 is now riding a four-week winning streak — making it an impressive 13 out of 14 positive weeks — and has gained more than 20% since the October 2023 lows. The consistent buying pressure has recently created overbought conditions, especially within the technology sector. While markets can remain overbought for extended periods, especially in strong bull markets, extremes in momentum often portend price pullbacks or consolidation phases.
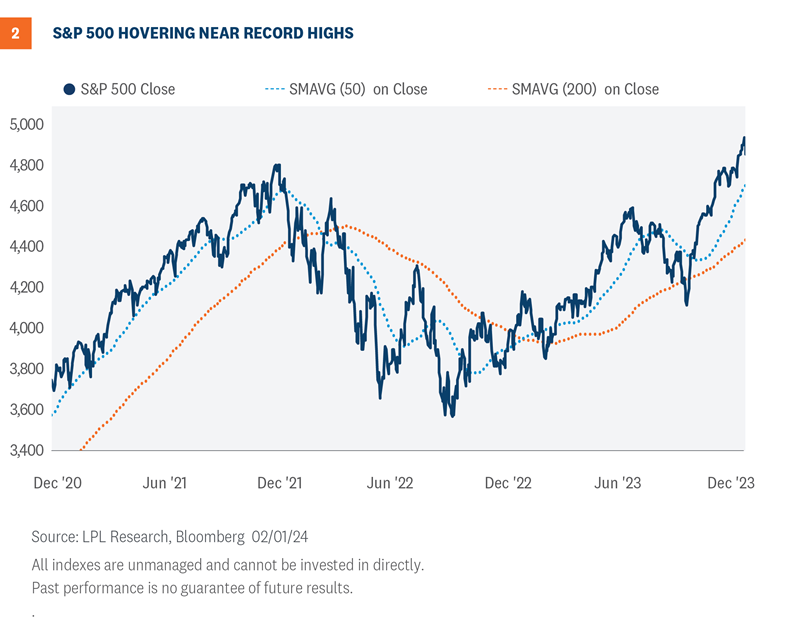
As illustrated in the “S&P 500 Hovering Near Record Highs” chart, the index has recently climbed to over a 10% premium to its 200-day simple moving average (SMAVG), marking about a one-standard-deviation move above its 30-year average and raising the odds for potential reversion to its mean.
Market breadth has also not kept up with the pace of the rally. For example, declining shares modestly outpaced advancers last month and there were fewer S&P 500 stocks making new 52-week highs in January than in December. This negative divergence, defined by the S&P 500 moving higher as breadth metrics move lower, further raises the odds of a potential pullback or consolidation phase for stocks. This technical evidence does not suggest the bull market is over but does serve as a reminder they are not linear. Pullbacks and even corrections are completely normal within the context of a bull market. They allow for fundamentals to catch up with price action, reset often overly exuberant sentiment, prevent bubbles, and provide entry points for new capital to enter the market.
In terms of potential entry points, the next key downside support levels for the S&P 500 set up near 4,830, 4,800, and 4,726.
Conclusion
The January Barometer tells us that stocks are likely to gain ground between now and the end of 2024. Meanwhile, over the course of the year, we expect easing inflation, stable or lower interest rates, and an expected ramp-up in earnings to support additional modest gains for stocks — potentially above our year-end fair value target of 4,950. Meanwhile, the presidential cycle may give the economy and stocks an added push to keep this still-relatively young bull market marching higher. The path to more gains won’t be linear given the macroeconomic and geopolitical challenges that lie ahead. Valuations are on the high side and corrections frequently happen during election years, even in bull markets.
Asset Allocation Insights
LPL’s Strategic and Tactical Asset Allocation Committee (STAAC) maintains its neutral equities stance despite the strength of the latest stock market rally and continues to see the risk-reward trade-off for stocks and bonds as well balanced. It appears more likely than not that the S&P 500 may end the year above our year-end fair value target of 4,950. That said, upside from here may be modest for both stocks and bonds, and the range of potential outcomes is wide.
Within equities, the STAAC continues to favor a tilt toward domestic over international equities, with a preference for Japan among developed markets, and an underweight position in emerging markets (EM). The Committee also recommends a slight tilt toward large caps and growth stocks. Finally, the STAAC continues to recommend a modest overweight to fixed income, funded from cash.
Jeffrey Buchbinder, CFA, Chief Equity Strategist
Adam Turnquist, CMT, Chief Technical Strategist
–
The opinions voiced are for general information only and are not intended to provide specific advice or recommendations for any individual.